Chemistry#
FastChem Wrapper#
We can compute mixing ratios for species in atmospheres with equilibrium chemistry
using FastChem. For your convenience, we
wrap the FastChem python API in the class FastchemWrapper, which
makes it easy to compute the quantities needed in this package.
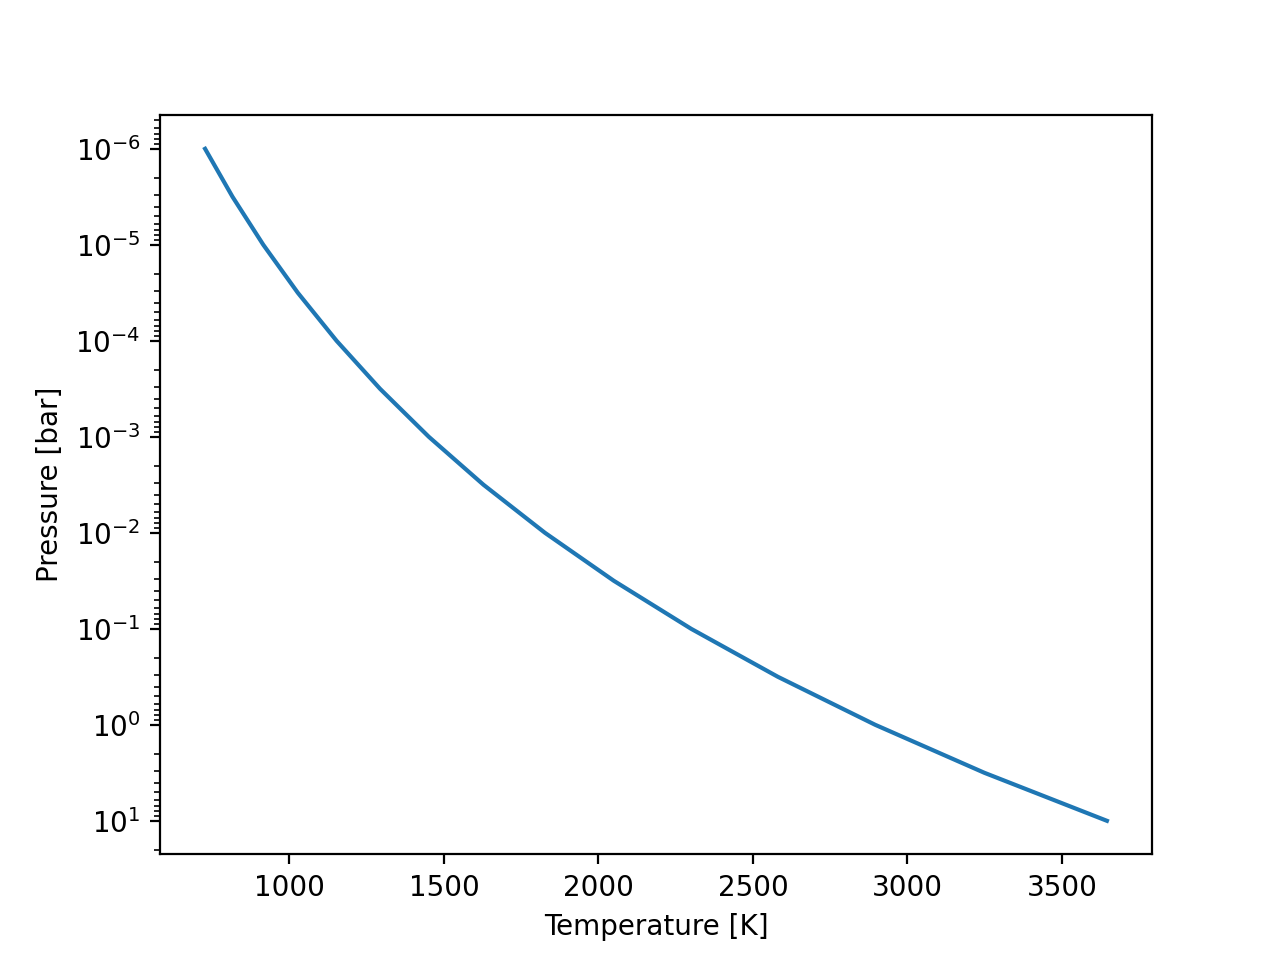
Let’s construct a atmospheric structure (temperature-pressure curve):
import numpy as np
import matplotlib.pyplot as plt

pressure = np.geomspace(1e-6, 10, 15)  # [bar]
temperature = 2300 * (pressure / 0.1) ** 0.1  # [K]

ax = plt.gca()
ax.semilogy(temperature, pressure)
ax.invert_yaxis()
ax.set(
    xlabel='Temperature [K]',
    ylabel='Pressure [bar]'
)
(Source code, png)
Radiative transfer calculations require the volume mixing ratio (VMR) of each atmospheric species. The VMR is a function of temperature, pressure, atmospheric metallicity, and the carbon-to-oxygen ratio. We specify these parameters as follows:
from shone.chemistry import FastchemWrapper

chem = FastchemWrapper(
    temperature, pressure,
    # these are in linear (not log) units:
    metallicity=1,  # M/H
    c_to_o_ratio=1  # C/O
)
Warning
There are known issues for FastChem users on Macs with “Apple silicon” ARM processors. You may see a warning when running the code above if you use these processors. The spurious FastChem results are most likely to occur for calculations at low temperatures and pressures.
The wrapper can enumerate the names, symbols, weights, and indices for each
species with get_species:
species_table = chem.get_species()
print(species_table[:5])  # first five species
Returns a table like this:
| index | name | weight | type | |
|---|---|---|---|---|
| symbol | ||||
| e- | 0 | Electron | 0.000549 | element |
| Al | 1 | Aluminium | 26.98 | element |
| Ar | 2 | Argon | 39.948 | element |
| C | 3 | Carbon | 12.011 | element |
| Ca | 4 | Calcium | 40.078 | element |
Volume mixing ratio#
We compute the matrix of volume mixing ratios for all species with
vmr, and index it for a particular
species:
# lookup the column index for O2 in the fastchem VMR matrix:
idx = species_table.loc['O2']['index']
vmr_O2 = chem.vmr()[:, idx]
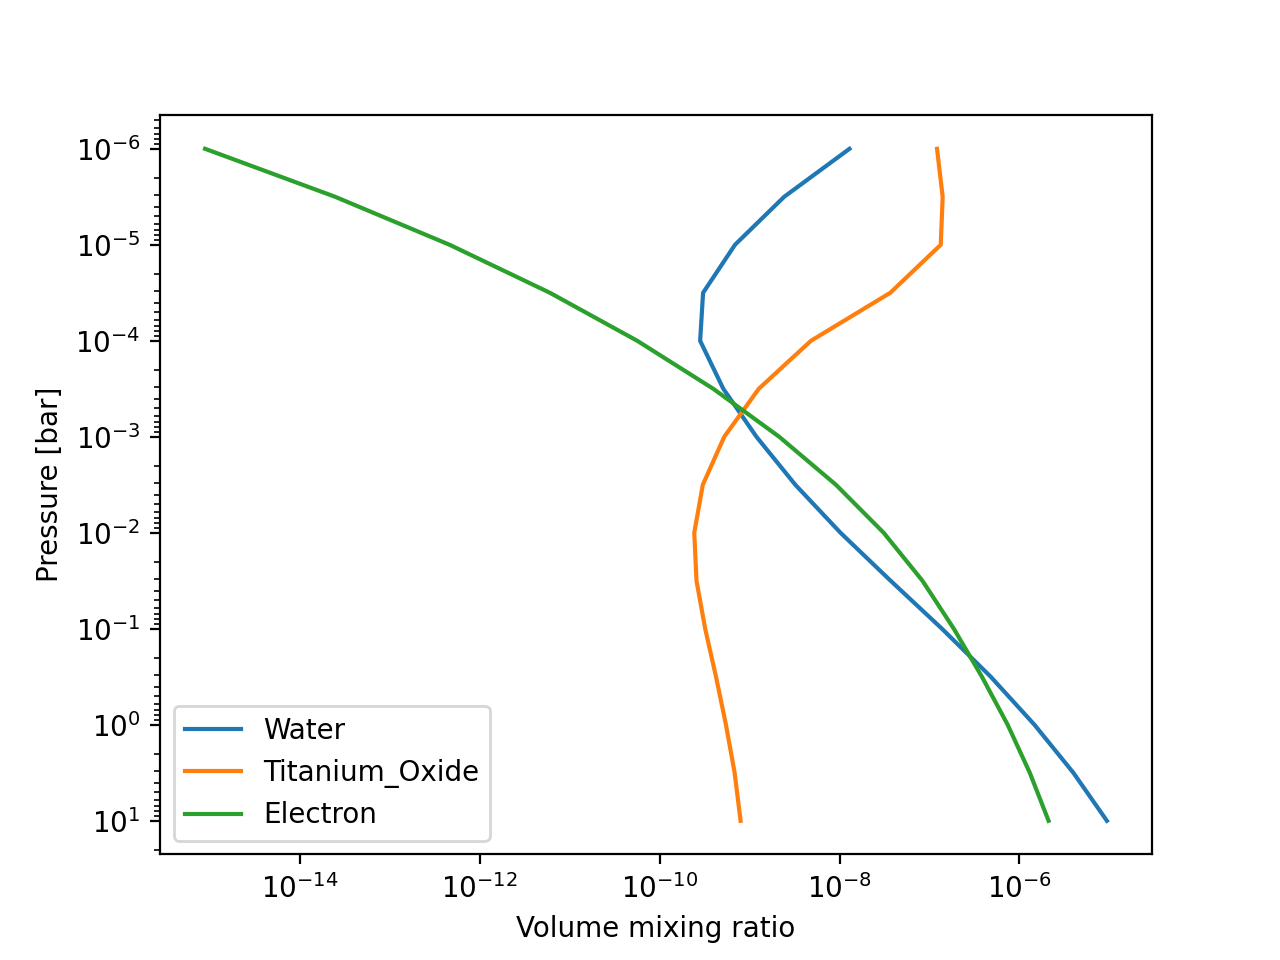
We can plot the VMRs of several species as a function of pressure like so:
import matplotlib.pyplot as plt

species = ['H2O1', 'O1Ti1', 'e-']
indices = species_table.loc[species]['index']
names = species_table.loc[species]['name']

ax = plt.gca()
ax.loglog(chem.vmr()[:, indices], pressure, label=names)
ax.legend(loc='lower left')
ax.invert_yaxis()
ax.set(
    xlabel='Volume mixing ratio',
    ylabel='Pressure [bar]'
)
(Source code, png)

Mass mixing ratio#
The mass mixing ratio (MMR) is equivalent to the volume mixing ratio multiplied
by the mass of the species and divided by the mean molecular weight. Since
mean molecular weight is often a free parameter in a real atmospheric retrieval, we
can’t return “one MMR” per FastChem run. So FastchemWrapper has
a method called mmr_mmw which returns the VMR
multiplied by the molecular mass, which is equivalent to the MMR multiplied by
the mean molecular weight. To convert this to mass mixing ratio, simply divide
the result of mmr_mmw by the mean molecular weight.
Opacity grids are often stored as cross sections per mass, usually written as \(\kappa\) [\({\rm cm}^2~{\rm g}^{-1}\)]. To compute an extinction coefficient \(\alpha\) [\({\rm cm}^{-1}\)], we must multiply the opacity \(\kappa\) by the mass density of the species \(\rho\) [\({\rm g~cm}^{-3}\)].
Precompute FastChem on grid#
Build a grid#
As the name suggests, the FastChem is fast! That said, computing it millions of times
during Monte Carlo sampling may not be the best use of your time for species with mixing
ratios that vary smoothly with temperature, pressure, M/H, and C/O. We have included a
convenience function called build_fastchem_grid that runs FastChem in
a loop over these four dimensions to create a ~100 MB grid of abundances for each species
in less than a minute on a laptop:
from shone.chemistry import build_fastchem_grid

build_fastchem_grid()  # returns a chemistry grid and saves it to disk
The grid is saved to your shone directory and can be interpolated during
sampling to use approximate FastChem mixing ratios. The default limits for
each dimension are enumerated in the documentation for
build_fastchem_grid.
Interpolate from the grid#
Now let’s print a table of volume mixing ratios for the first five species:
from shone.chemistry import get_fastchem_interpolator, fastchem_species_table

# load the jitted chemistry interpolator:
interp_chem = get_fastchem_interpolator()

# load a table listing all species:
species_table = fastchem_species_table()

temperature = 2300  # [K]
pressure = 1e-3  # [bar]
log_m_to_h = 0.3
log_c_to_o = -0.2

# interpolate on all four axes, return VMR for
vmr = interp_chem(temperature, pressure, log_m_to_h, log_c_to_o)

# add a column to the table of species with the VMRs:
species_table['vmr'] = vmr[0]

print(species_table[:5])
| index | name | weight | type | vmr | |
|---|---|---|---|---|---|
| symbol | |||||
| e- | 0 | Electron | 0.00055 | element | 1.9e-06 |
| Al | 1 | Aluminium | 27 | element | 8.9e-06 |
| Ar | 2 | Argon | 40 | element | 8.1e-06 |
| C | 3 | Carbon | 12 | element | 2.5e-12 |
| Ca | 4 | Calcium | 40 | element | 6.6e-06 |